A controller I worked with showed me her old anomaly dashboard once. It had 1,800 unread alerts in it. She'd given up on it eight months earlier. The first ten alerts were real. The next 1,790 were noise.
That's the failure mode you have to design against. A spend anomaly detector will only earn trust twice. The first time it catches something that mattered, the AP team trusts it. The second time it cries wolf on what turns out to be normal seasonal spend, they tolerate it. The third false alarm and the dashboard becomes wallpaper.
We built Cadense's spend anomaly detector with one constraint above all others: silent is better than noisy. Every choice in the architecture exists to keep the signal-to-noise ratio high enough that a controller will keep opening the queue.
TL;DR
- The detector runs daily over a rolling 90-day baseline (configurable 2–365).
- It computes both classical stats (mean/stddev) and robust stats (median/MAD) so a single outlier in your history can't blind it.
- Five independent signals — legacy z-score spike, robust z-score spike, flat baseline spike, rare spend spike, large transaction contributor. The maximum score wins.
- Two noise filters — minimum amount floor and minimum category confidence — kill the long tail before it reaches the queue.
- Anomalies are fingerprinted so re-runs upsert rather than duplicate.
The wolf problem, with numbers
Imagine your Legal Fees category has these daily spends over a 90-day baseline (most days $0, a $50k invoice on day 47):
[0, 0, 0, ..., 50000, ..., 0, 0, 0] ← classical mean = $556, classical stddev ≈ $5,275
Now yesterday you spent $8,000 on legal fees — a real, worth-investigating spike for any normal-sized business. Classical z-score:
z = (8000 − 556) / 5275 ≈ 1.41 ← below the typical 2-sigma threshold, no flag
Worse: that $50k outlier doesn't go away. It permanently inflates your stddev for as long as it sits in the baseline window. The dashboard goes silent. You won't see another legal-fees flag until you spend something north of $11k in a day.
Robust statistics ignore that outlier:
median = $0, MAD = $0 → flat-baseline path triggers instead
The detector falls back to the flat baseline spike signal, which catches "this category was effectively quiet, and now it isn't." Yesterday's $8k flags clean.
That's the entire point of using two statistical lenses. Different baselines fail in different ways; combining them covers more shapes.
What the detector does, mechanically
Every morning, the detector looks at yesterday's spend, broken down by category and currency, and asks: was this normal?
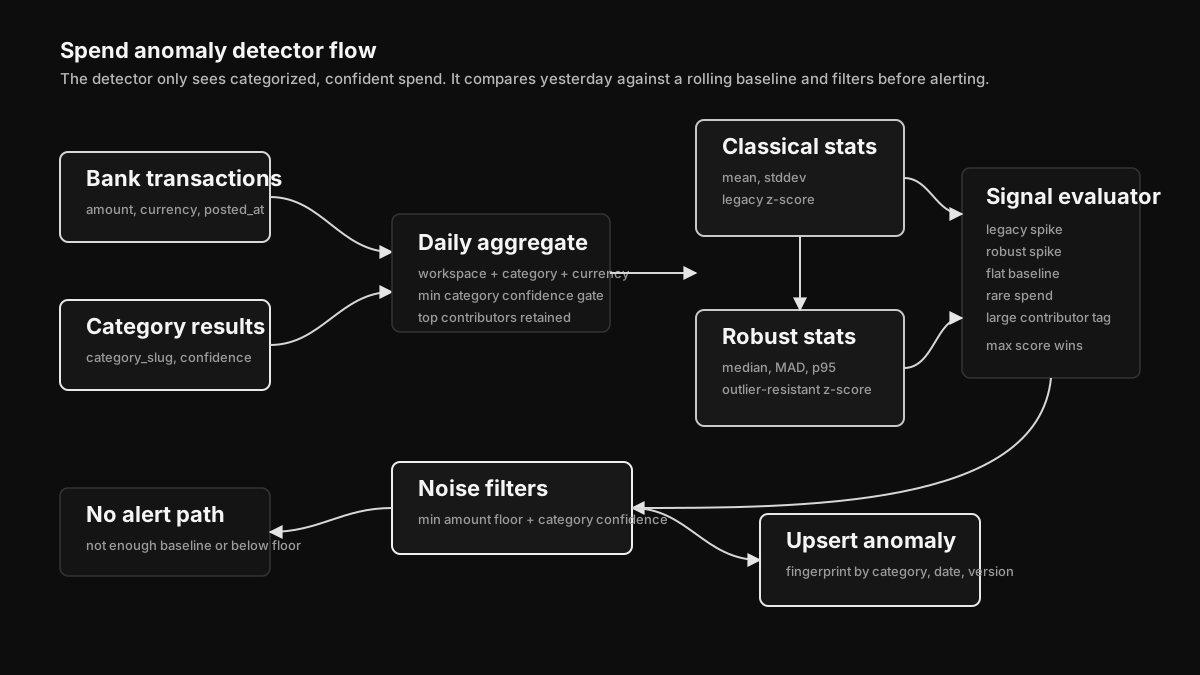 Only confidently categorized spend enters the aggregate. The detector compares yesterday against classical and robust baselines, evaluates independent signals, filters noise, then upserts an anomaly record when something is worth review.
The entry point in packages/banking-anomaly/src/detector.ts:
export async function detectAnomalies(
workspaceId: string,
asOf: Date,
options: DetectorOptions
): Promise<DetectedAnomaly[]> {
const baseline = await loadBaseline(workspaceId, asOf, options.windowDays)
const yesterday = await aggregateYesterdaySpend(
workspaceId, asOf, options.minCategoryConfidence )const anomalies: DetectedAnomaly[] = []
for (const [key, todaySpend] of yesterday) {
const baselineSlice = baseline.get(key)
if (!baselineSlice || baselineSlice.activeObservations < options.minObservations) {
continue // not enough data to trust the baseline
}const classical = computeStats(baselineSlice.dailyTotals)
const robust = computeRobustStats(baselineSlice.dailyTotals)
const signals = evaluateSignals(todaySpend, classical, robust, options)
if (signals.length === 0) continue
const maxScore = Math.max(...signals.map((s) => s.score))
if (todaySpend < options.minAmountMinor) continue // amount-floor filter
anomalies.push(buildAnomalyRecord(key, todaySpend, signals, maxScore))
} return anomalies}computeStats returns mean and stddev; computeRobustStats returns median, MAD (scaled by 1.4826), and the 95th percentile.
The five signals
1. Legacy z-score spike
Classical: z = (yesterday − mean) / stddev. If z >= sigmaThreshold (workspace-configurable, typically 2–3), the signal fires.
Score: 0.7 + 0.25 × clamped(excess_multiplier)
This is the textbook approach. It's here because it's familiar, and on clean baselines it works fine.
2. Robust z-score spike
Same formula, using median and mad_stddev instead of mean and stddev.
Score: 0.72 + 0.25 × clamped(excess_multiplier)
The slightly higher base score reflects that this signal is harder to fool — when robust z fires, it's usually a real spike. This is the signal that catches the legal-fees example above when the classical z-score gets blinded.
3. Flat baseline spike
If the baseline has effectively zero variance (everyone spent the same amount or nothing at all), the z-score formulas blow up. We catch that explicitly: if yesterday's spend exceeds 2× the historical mean and exceeds the workspace's minAmountMinor floor, fire.
Score: 0.82 + 0.13 × clamped(multiple / 10)
This is what catches "this category was dormant and now it isn't."
4. Rare spend spike
If calendarMode includes calendar days and the category has never had any spend in the baseline (zero spend-days), but yesterday it did — fire.
Score: 0.78
This is the "first dollar in a new category" signal. It's deliberately uncommon and high-precision. Catches new types of spend that weren't budgeted.
5. Large transaction contributor
Not a standalone fire — it's a tag added to other signals. If the anomalous spend came from a single large transaction rather than many small ones, the anomaly record is annotated with large_transaction_contributor so the reviewer immediately sees whether the spike is one outsized check or a cluster of normal ones. Different remediation paths.
| Signal | Catches | Score base |
|---|---|---|
| Legacy z-score spike | Classical mean/stddev spike | 0.70 |
| Robust z-score spike | Median/MAD spike (outlier-resistant) | 0.72 |
| Flat baseline spike | Spike when historical variance ≈ 0 | 0.82 |
| Rare spend spike | First-ever spend in a category | 0.78 |
| Large transaction contributor | Spike came from one big transaction | (context tag) |
Calendar mode: the highest-leverage knob
A category like rent has a regular cadence — one payment a month, zero spend the other 29 days. A category like meals has spend on most weekdays and very little on weekends. The "right" baseline for these is different.
calendarMode lets the workspace pick:
| Mode | Best for | What it counts |
|---|---|---|
spend_days | Erratic categories (legal, marketing) | Only days that had spend |
calendar_days | Recurring categories (rent, payroll) | Every day including zeros |
hybrid | Mixed portfolios | Picks automatically per category per run |
This single knob has more effect on noise than any threshold change. Wrong mode for a category and you'll either miss real anomalies or flag normal patterns endlessly.
Two filters that keep the queue clean
A signal can fire and still be filtered out before it reaches the AP team. Two filters guard the output:
- Amount floor (
minAmountMinor). Per-workspace. A typical setting is5000(~$50). Anomalies below that floor never surface. This is the single most effective noise control — it eliminates the long tail of tiny anomalies that aren't worth a human's time. - Category confidence (
minCategoryConfidence, default0.55). Only transactions whose categorization confidence exceeds this threshold are included in the daily aggregate. Transactions with weak categorization are excluded — we don't want to flag a "spike in software spend" that's really a $10k transaction that got coded to software because the embedding had nothing else to go on.
The second filter is why we built the categorization engine the way we did. Categorization confidence isn't decorative; it's a load-bearing input to the anomaly detector.
Severity and the score-to-action mapping
The final score is mapped to a severity label:
| Severity | Score range | Default action |
|---|---|---|
| Critical | ≥ 0.95 | Top of queue + email/Slack notification |
| High | ≥ 0.85 | Top-of-queue card |
| Medium | ≥ 0.70 | Standard queue entry |
| Low | > 0 | Background card |
Severity drives both the UI surface and downstream automation. A critical anomaly can trigger the Spend Exception Monitor template — which posts to Slack and opens a Linear ticket — without any additional config.
Idempotent runs via fingerprinting
Each anomaly is fingerprinted by (workspace, category_slug, currency, anomaly_date, detector_version). If the detector runs twice on the same day — re-runs, retries, redeployments — the second run upserts into the existing record rather than creating a duplicate. We track firstDetectedAt and lastDetectedAt so the UI can show "we've been seeing this every day for 4 days" vs. "first detected today."
The detector version is part of the fingerprint deliberately. When we ship a new detector version, prior anomalies stay tied to the old version and new anomalies are tagged with the new one. You can re-run the new version against history without trampling the old records.
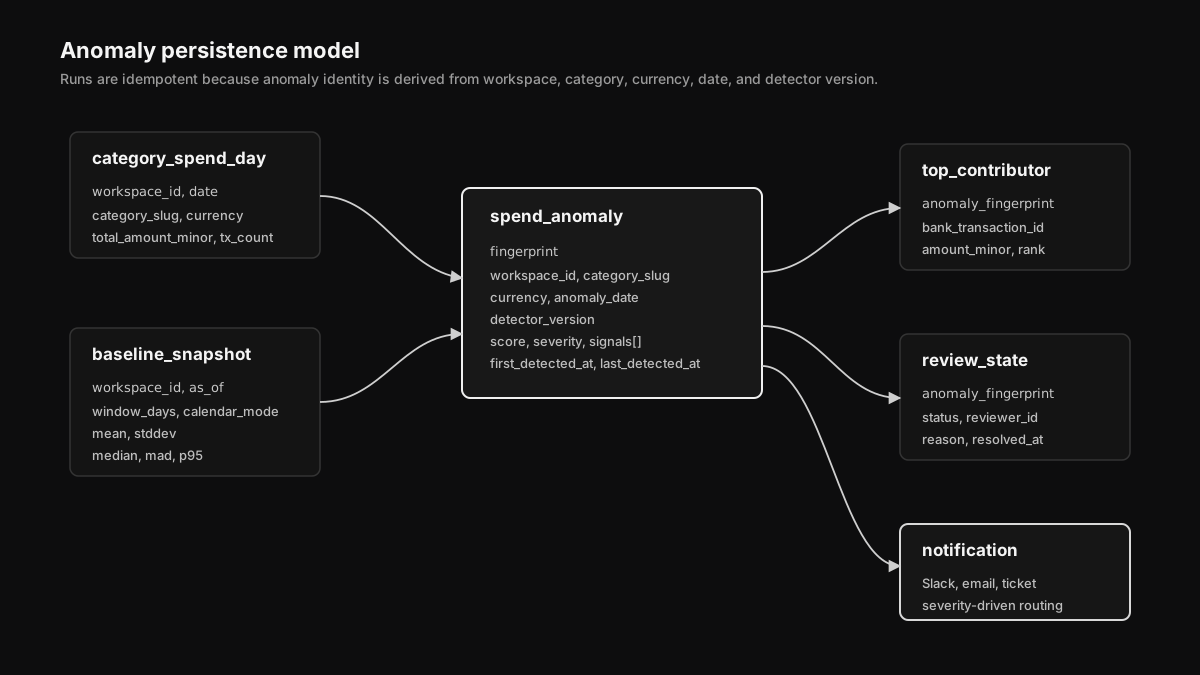 Daily category spend and baseline snapshots feed a versioned anomaly record. Contributors, review state, and notifications reference the same fingerprint, so retries update the same operational object.
What the detector doesn't do
Some honest limits:
- No feedback loop. If a controller marks an anomaly as "expected, ignore," that signal isn't fed back into the baseline. The same pattern will flag again next month. We left the loop out for the same reason as in categorization — we'd rather ship without a learning loop than ship one that drifts.
- No seasonality model. A category that spends $5k in winter and $20k in summer will look anomalous every June if the baseline straddles winter months. Workaround today is to shorten the baseline window for known-seasonal categories; a real seasonality model is on the roadmap.
sigmaThresholdis per-workspace, not per-category. A high-variance category (marketing) and a stable one (rent) share the same threshold. Edge cases get over- or under-flagged. A future version will allow per-category overrides.- Top contributor list is amount-ranked, not causally attributed. The anomaly record stores the top 25 transactions by amount on the spike day. That's usually what you want — but if 100 small transactions caused the spike, you only see the top 25.
- Currencies are independent. A workspace that spends both USD and EUR gets separate anomalies per currency. We don't FX-normalize for combined detection.
Why this shape
The whole detector is built around one bias: silent is better than noisy. Every choice in the architecture — robust stats, the amount floor, the category-confidence filter, abstain-when-unsure — is there to keep the dashboard signal you can trust. A controller who looks at the anomaly queue should see things that are worth looking at, not have to learn which signals to mute.
When we get the loop and the seasonality model in, the same constraint will apply: ship them only if they raise precision without raising volume. The day the queue feels like a lottery is the day controllers stop opening it.
The detector is the third pillar of the AP brain — it sits alongside the categorization engine (which decides what a transaction is) and the reconciliation engine (which decides what matches a transaction). All three share the same instinct: deterministic where possible, conservative where not, and never confidently wrong.
The detector lives in packages/banking-anomaly. detectAnomalies is the entry; detector.ts is short and worth a read.
FAQ
Why does Cadense use robust statistics instead of a classical z-score?
A single outlier in the baseline (e.g., one $50k legal invoice) inflates standard deviation enough that subsequent legitimate spikes never flag. Robust stats use median and MAD (Median Absolute Deviation) which ignore single-point outliers, so the detector keeps working after a one-time spike.
How is the spend baseline computed?
Per (workspace, category, currency), we aggregate daily spend totals over a rolling window (default 90 days, configurable 2–365). We compute both classical (mean, stddev) and robust (median, MAD scaled by 1.4826, p95) statistics. We require at least 15 active observations before trusting the baseline.
What is calendar mode and why does it matter?
Calendar mode controls whether zero-spend days count toward the baseline. spend_days mode only counts days with spend (best for erratic categories like marketing). calendar_days counts every day including zeros (best for recurring categories like rent). hybrid picks per-category based on the historical density of non-zero days.
Will the detector flag the same anomaly twice if I re-run detection?
No. Each anomaly is fingerprinted by (workspace, category, currency, date, detector_version) and upserted, so re-runs update existing records. We track firstDetectedAt and lastDetectedAt to show how persistent an anomaly is.
How do you control noise from small transactions?
Two filters. minAmountMinor sets a per-workspace dollar floor (typical: $50) below which anomalies never surface. minCategoryConfidence (default 0.55) excludes transactions with weak categorization from the daily aggregate, so a spike in "software" caused by a poorly-categorized $10k transaction never reaches the queue.
Does the detector account for seasonality?
Not yet. A category that spends $5k in winter and $20k in summer will look anomalous every June if the baseline straddles winter months. The current workaround is to shorten the baseline window for known-seasonal categories. A real seasonality model is on the roadmap.